Final Report
Jenna Gottschalk, Hechen Li, Ahmed Rabbani, Ahindrila Saha, Sai Yang
1. Background
According to the World Health Organization, 5% of the world population suffers from speech-hearing impairment. Sign language recognition is an indispensable foundation for machine translation to bridge the gaps in communication between the hearing and the hearing-speech impaired communities.
2. Problem Definition
Sign language translation takes an image containing a sign language gesture and outputs the corresponding meaning as text. It can be divided into two major steps: feature extraction and classification. Earlier approaches use PCA and Kurtosis position [1] for feature extraction and Hidden Markov Model [1] or SVM [2] for classification. With the advance of deep learning, recent models using CNN [3] generally outperform previous methods. However, CNN-based models learn from the RGB pixel data directly. While some methods use more advanced skeleton features [4], this requires users to wear tracking devices. Therefore, we want to explore a new approach that only requires image input: extract hand skeletons from images using the state-of-the-art MediaPipe framework [5], and then use supervised algorithms to perform the classification.
3. Data Collection and Preprocessing
3.1 Feature extraction
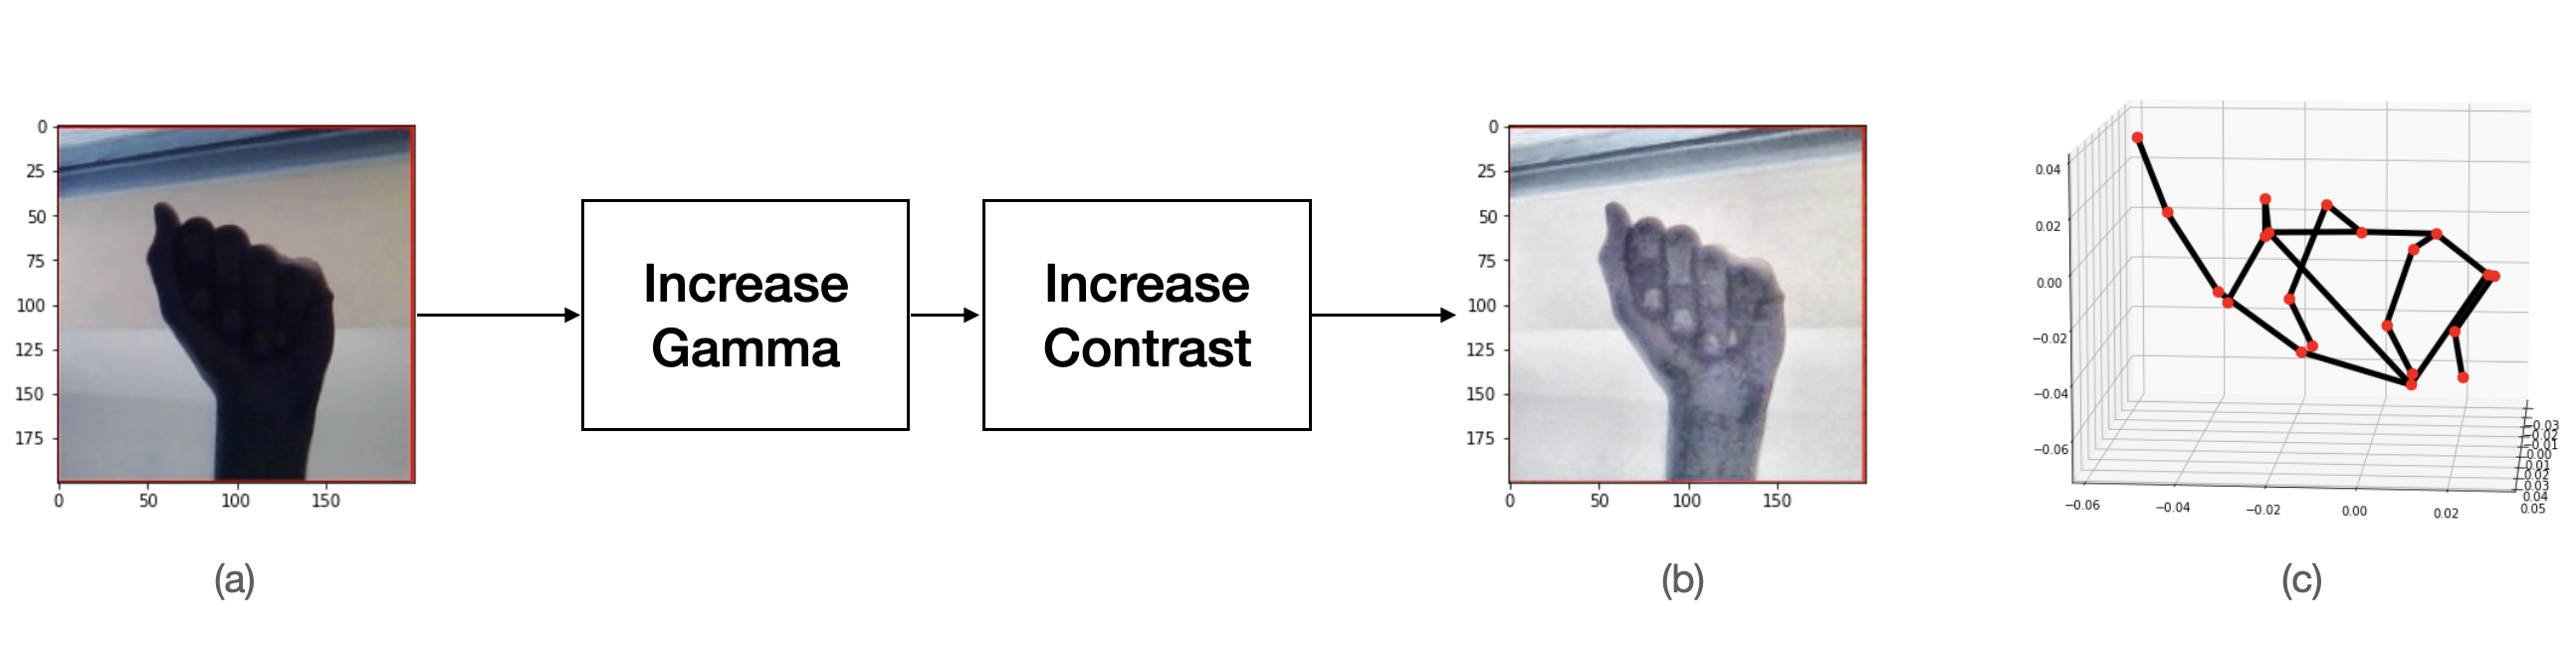
In the data preprocessing stage, we utilized the ASL Alphabet dataset of 87,000 labeled images and the ASL Alphabet Test dataset of 870 labeled images with noisy backgrounds. We extracted the features from the image data using MediaPipe[5]. Given an input frame, MediaPipe detects the hand in the image and outputs the position of 21 key points on the hand. We used the (x, y, z) coordinates of these points as features, so there are 63 features in total. Although we can learn from the pixel data directly, we prefer this state-of-the-art pose detection framework, which extracts more structural and meaningful features than CNN or general image feature extractors.
We ran MediaPipe on the input images. However, MediaPipe failed to detect the hand in many of them. After inspection, we think this was due to dark images: some images only show silhouettes of hands. Therefore, before feeding the image into MediaPipe, we first increased the exposure by adjusting the gamma value and then increased the contrast. These two steps were implemented using two OpenCV filters. We also set the maximum hand number to 1 and minimal detection confidence to 0.1 because the input images are guaranteed to have one and only one hand. After the transformations, more images were recognized by MediaPipe. As shown in figure 1 (b), the processed image is more clear than the original one. MediaPipe failed to extract features for a portion of images, which may be due to the images being too dark or lack of separation between the fingers in the images. We discarded images that were not recognized by MediaPipe. Additionally, we discarded images with labels ‘J’ and ‘Z’ because these sign language gestures involve movement that cannot be easily captured with a single image, and we discarded images with labels ‘delete’ and ‘space’ because we are only classifying letters. Overall, 59,822 images in the ASL dataset (69%) were used.
3.2 Data preprocessing for unsupervised Learning
The raw data from MediaPipe contains hand coordinates in different rotation angles and scales. We decided to use it directly in supervised learning because we are building a classifier that should be able to handle rotated and scaled input images. However, for unsupervised learning, the raw data needed to be further normalized to compare different languages under one latent space. We first designed a method to correct the rotation shown in figure 2.
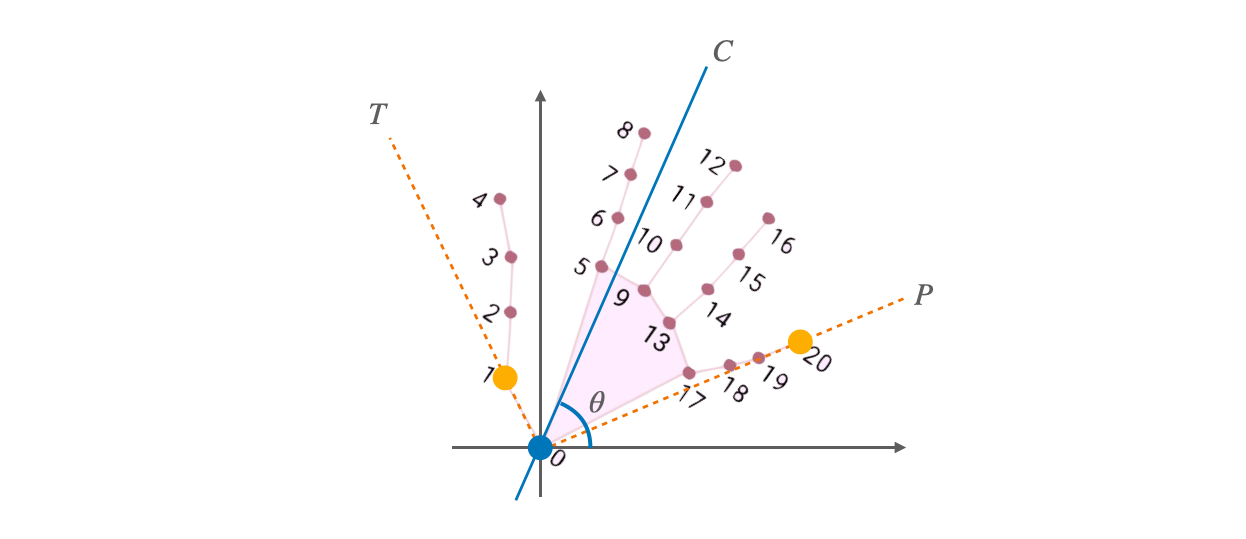
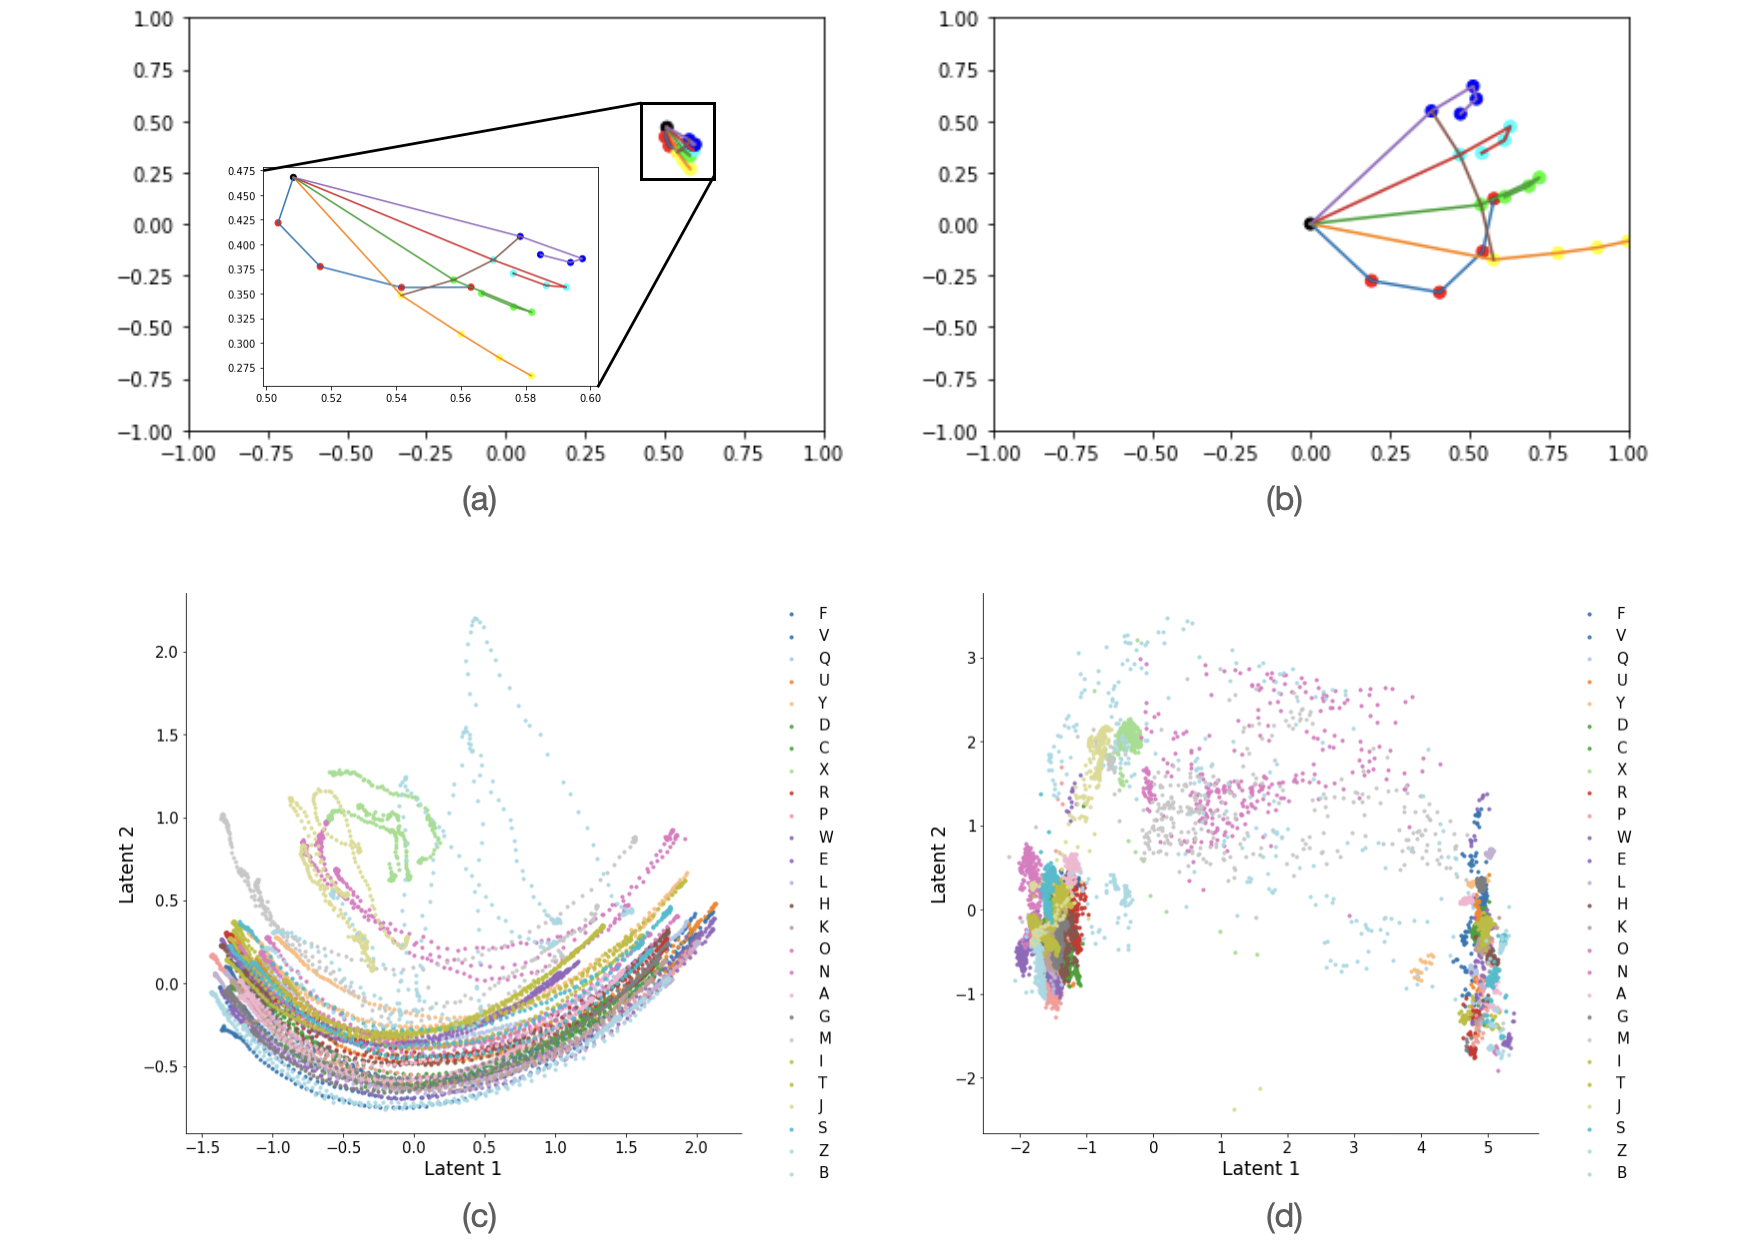
From the skeleton, we draw a line between the wrist (point 0) and each of the points belonging to the thumb and the small finger (points 1-4, 17-20). From all those lines, we find the two at the boundary, i.e. the two with minimum and maximum angle inclination (T and P in the figure, corresponding point 1 and 20). Then we draw a middle line C at the angle bisector of P and T. We use the angle θ between C and the x-axis as the detected rotation of this image. Finally, we rotate the skeleton by -θ to make it point to the right, and normalize the X and Y coordinates, i.e. stretch the points to span a [1, 1] square, where the wrist is at (0, 0). The result for a single hand is illustrated in Figure 3 (a)(b). Figure 3 (c)(d) shows the PCA result before and after normalization for the Irish Sign Language dataset. We can see that extra data noise caused by rotations and scales has been removed after normalization, and there are clear boundaries between the clusters.
4. Methods
4.1 Supervised Learning
Feature Engineering
We tried three different dimensionality reduction methods: Principal Component Analysis, Linear Discriminant Analysis, and LASSO. For Principal Component Analysis and Linear Discriminant Analysis, we selected the components that explained at least 95% of the variance of the original extracted features. For LASSO, we performed cross-validation to find the optimal value of alpha, the parameter that balances minimizing the residual sum of squares and minimizing the sum of squared coefficients. Using this value of alpha, we performed LASSO and selected the features with non-zero coefficients from LASSO to select a subset of the extracted features. We evaluated the performance of the results from Principal Component Analysis, Linear Discriminant Analysis and LASSO using K-Nearest Neighbors, Support Vector Machine, and Logistic Regression. We chose the dimensionality reduction method with the highest performance on these models, and we used the results of this method as input for the machine learning models.
Model Fitting
In the modeling stage, we first performed supervised machine learning. We divided our entire dataset into training and testing sets (80 percent training and 20 percent for testing). We used the selected features from LDA, the best-performing feature engineering method that we tested, to fit multiple classification models. They include conventional classification models, for example logistic regression and SVM, and non-linear models like gradient boosting and neural network. For model evaluation, we used the metrics F1 score, precision, and recall to assess and compare the general performance of each model. We also compared the model performance on each label based on the F1 score.
4.2 Unsupervised Learning
We compared gestures across different sign languages by clustering extracted features from images of letters from Brazilian, Irish, Indian, and American sign languages. We combined extracted features from the four sign languages, which included 41891 Indian sign language images (34%), 8850 Irish sign language images (7%), 4049 Brazilian sign language images (3%), and 69254 American sign language images (56%). We performed clustering on the combined dataset using K-means to explore similarities and differences of the gestures from the different sign languages.
First, we found the optimal number of clusters for K-means. We performed K-means with a range of values for the number of clusters, and we used the elbow method and silhouette scores to determine the optimal number of clusters. For the elbow method, we evaluated two metrics: inertia, the sum of squared distances of samples to their closest centroid, and distortion, the average euclidean squared distance from the centroid of the respective cluster. For the silhouette scores, we compared the silhouette score for each number of clusters tested. The silhouette score is computed with the average intra-cluster distance and average nearest-cluster distance for each sample, and values close to 1 indicate that a sample is far away from its neighboring clusters. We compared the plots of inertia and distortion with the silhouette scores for each number of clusters tested to find the optimal value. Then, we performed K-means with the optimal number of clusters. Apart from the performance measure using internal information, we also computed the matching-based metrics of precision, recall, and F-1 score for each cluster based on the ground truth label.
5. Results and Discussion
5.1 Supervised Learning
Dimensionality Reduction and Feature Selection
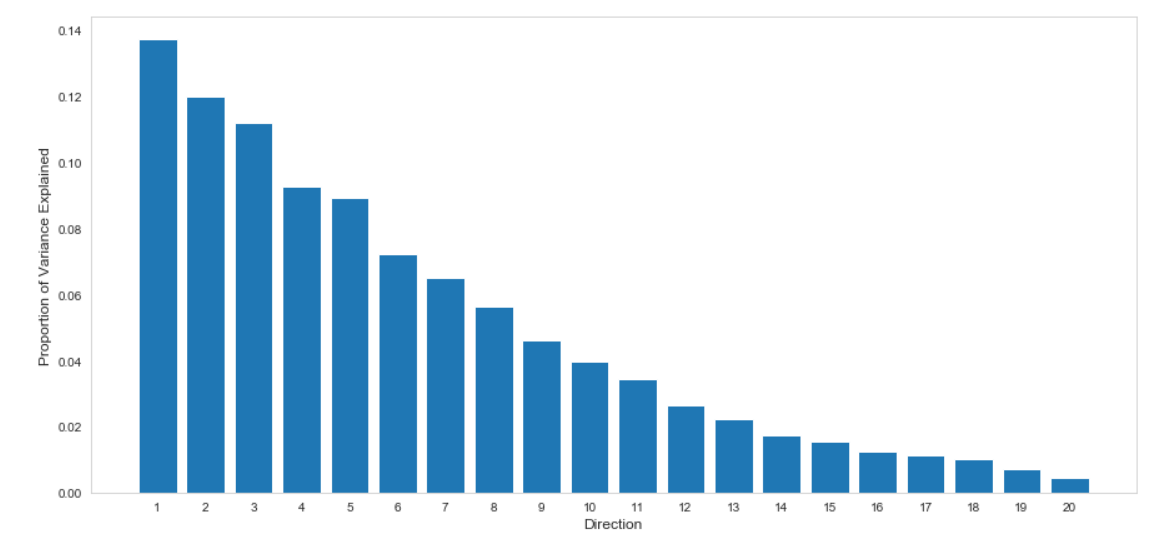
After performing Principal Component Analysis, we plotted the percentage of variance explained by each component. We observed that the first 10 components explained more than 95% of the variance in the original data set, which we selected to represent our training data. We repeated the same procedure while performing LDA and selected the first 10 LDA components to represent our training data (Figure 4).
We found that the optimal alpha value for LASSO is 2.0. However, LASSO regression with an alpha value of 2.0 reduced all of the coefficients to zero. Although not optimal, we performed LASSO regression with an alpha value of 0.5, which resulted in 6 selected coefficients that were chosen to represent our training data.
We evaluated the dimensionality reduction methods by comparing their accuracies across three classification models (Table 1). The LDA’s accuracy metric was the highest among the applied dimensionality reduction techniques.
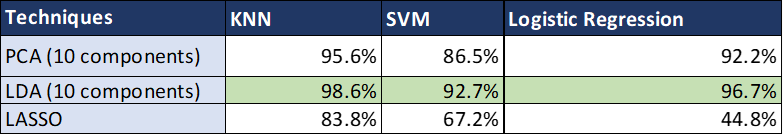
Linear Discriminant Analysis is a supervised learning method that takes the labels into account while performing dimensionality reduction. LDA chooses new dimensions such that the separability between different classes is maximized. Principal Component Analysis, on the other hand, is an unsupervised method that focuses on capturing the direction of maximum variation of the dataset. This may explain LDA’s higher performance across the three classification models. Additionally, we visually explored the clustering performed by the first 3 components of PCA and LDA respectively, and we observed that LDA resulted in more separated clustering as compared to PCA, which can be seen in Figure 5. So, we used LDA for performing dimensionality reduction and then used the compressed feature set for training.
Overall Model Performance
Using the first ten LDA components, we trained multiple supervised classification models and evaluated the overall performance of each model on our test dataset.
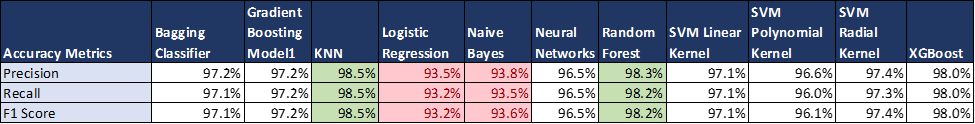
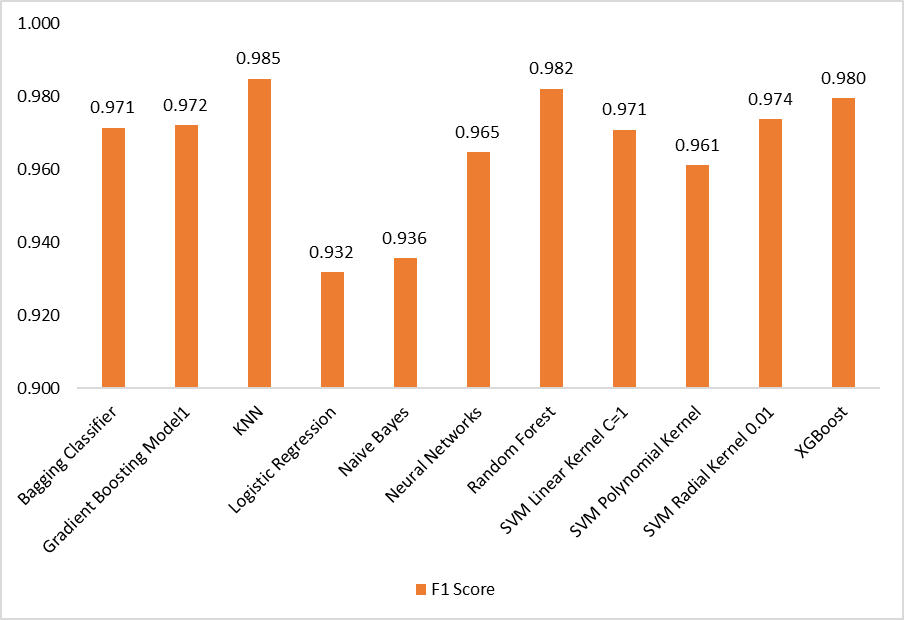
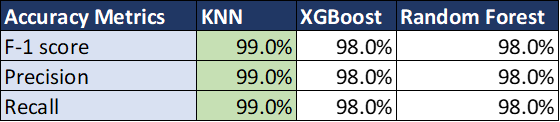
Table 2 shows the overall performance of all the supervised classification models that we trained. We computed the Precision, Recall, and F1 scores of each model on the test set. As per Table 2 and Figure 6, Random Forest and KNN outperformed other models on all performance metrics, which are greater than 98%. On the other hand, Logistic Regression and Naive Bayes performed poorly among all the models, with Precision, Recall and F1 Scores of less than 95%. The underlying reasons for the difference in observed performances were further explored through label-wise model evaluation, which is explained in subsequent sections.
Label-wise Model Performance
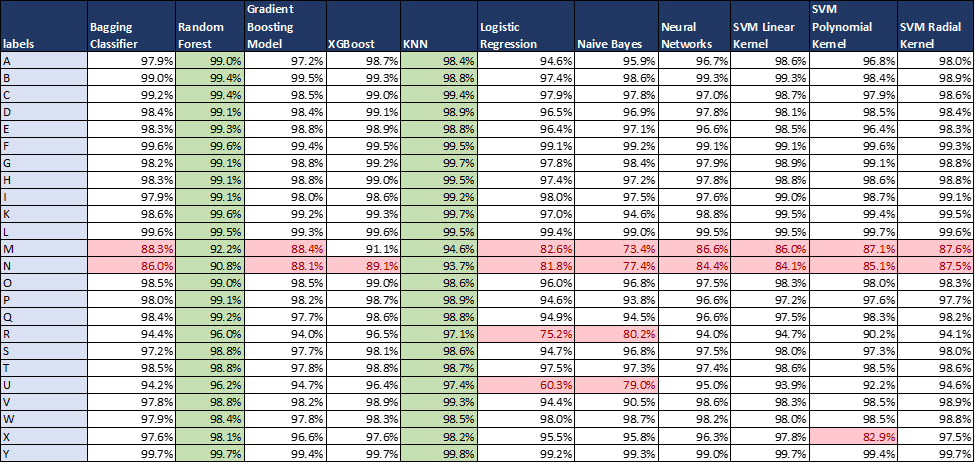
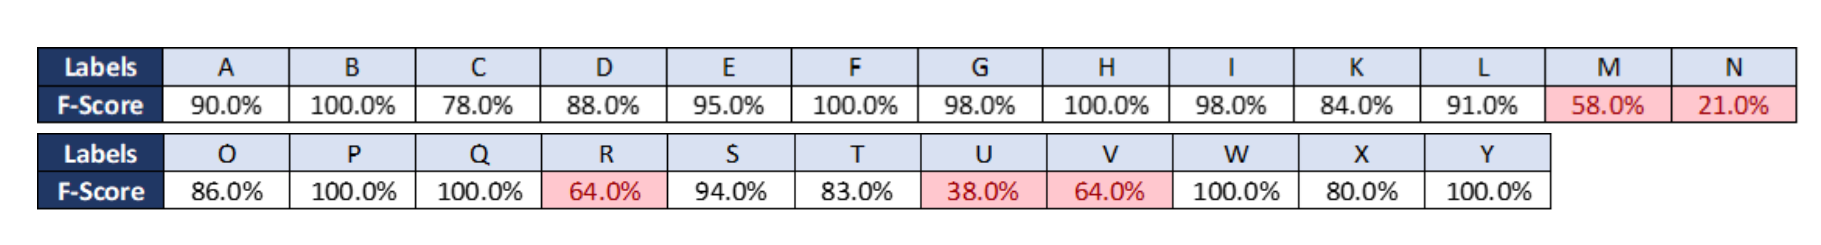
In Table 3, we compared the classification performance by using the F-1 scores across all labels and models on the test set. We prefer to use F-1 scores as it is the harmonic mean of both recall and precision and considers both of these metrics. The Random Forest and KNN outperform other models in terms of classifying all the labels accurately (F-1 scores are more than 90 percent for all labels). Logistic Regression and Naive Bayes perform poorly in classifying ‘U’ and ‘R’ where the F-1 scores are less than 80 percent especially for ‘U’ in logistic regression where the F-1 score value falls to 60 percent. For other models, except for letters ‘M’ and ‘N,’ all other labels have F-1 scores above 90 percent. The ‘M’ and ‘N’ scores have scores in the ranges of 85-90 percent, which can be further improved by feature engineering. One of the reasons for the lower F-1 scores of the labels is that the hand gestures for these letters are very similar. For example, if we compare the gesture/sign language of ‘M’ and ‘N’ their signs are almost identical (both are shown using joined hand fists). So, other models are not able to classify properly too similar-looking labels.
Hyperparameter Tuning
We did hyperparameter using Random Search CV for Random Forest, KNN and XG-Boost For each of the models, we selected the best value of the best parameters based on the training dataset. The optimal parameter values for each of the models are summarized below:
- XG-Boost
{'subsample': 0.6, 'n_estimators': 300, 'min_child_weight': 5, 'max_depth': 7, 'learning_rate': 0.1, 'gamma': 1.5, 'colsample_bytree': 0.8, 'alpha': 0} - KNN
{'p': 2(euclidean_distance), 'n_neighbors': 2, 'leaf_size': 30} - Random Forest
{'n_estimators': 800, 'max_features': 'sqrt'}
We selected the best model by checking the performance of each the algorithms with their best parameters on the validation dataset
We selected the best model by checking the performance of each the algorithms with their best parameters on the validation dataset:
We also compared the classification performance across all labels and classifiers on the validation dataset:
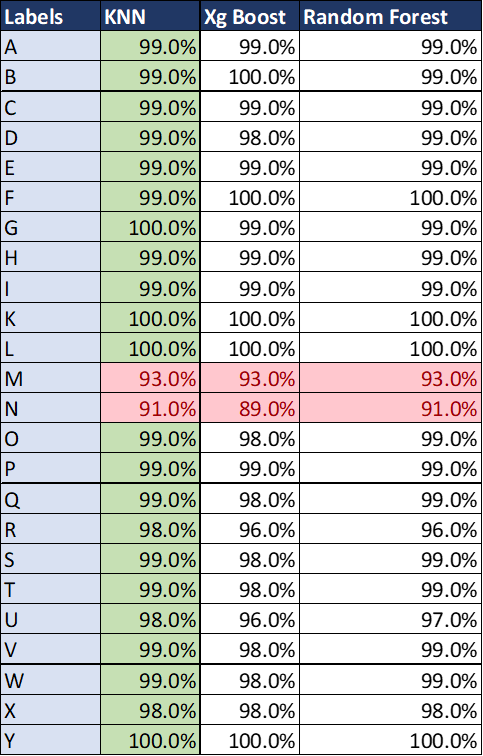
We can see that hyperparameter tuning improved the performance of all the labels except M and N. We selected KNN as it has the highest score for all classification metrics across all models.
Testing on Hold-out Data Set
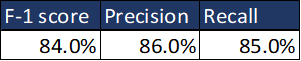
We also tested the performance of KNN models on an ASL test dataset with extremely dark and noisy backgrounds. The performance scores are below:
We also checked the performance across labels:
The KNN model achieved an overall F-1 score of 84% on the test dataset. However, the performance drops significantly when we compare across labels especially for N and U where the F-1 score is below 40%. So, though our model achieves a high score on the validation dataset, it fails to perform well when applied to new images for similar looking gestures like M and N. As a recommendation for future study, we can input raw images to a convolutional neural network, where optimum features for images can be extracted from images with the aid of convolution and max pooling layers. Then these features can be provided to a neural network that can perform classification of specific gestures. Neural network’s hyperparameters such as depth of layer and number of nodes, can be optimized in order to improve the classification of similar gestures such as M and N.
5.2 Unsupervised Learning
Optimal Number of Clusters
Between the four sign languages, there are 104 unique gestures, which we used as a point of reference for the number of clusters to test. To find the optimal number of clusters, we tested a range of values from 10 to 100. We plotted the inertia and distortion for K-means performed with each of these values, which can be seen in the figures below.
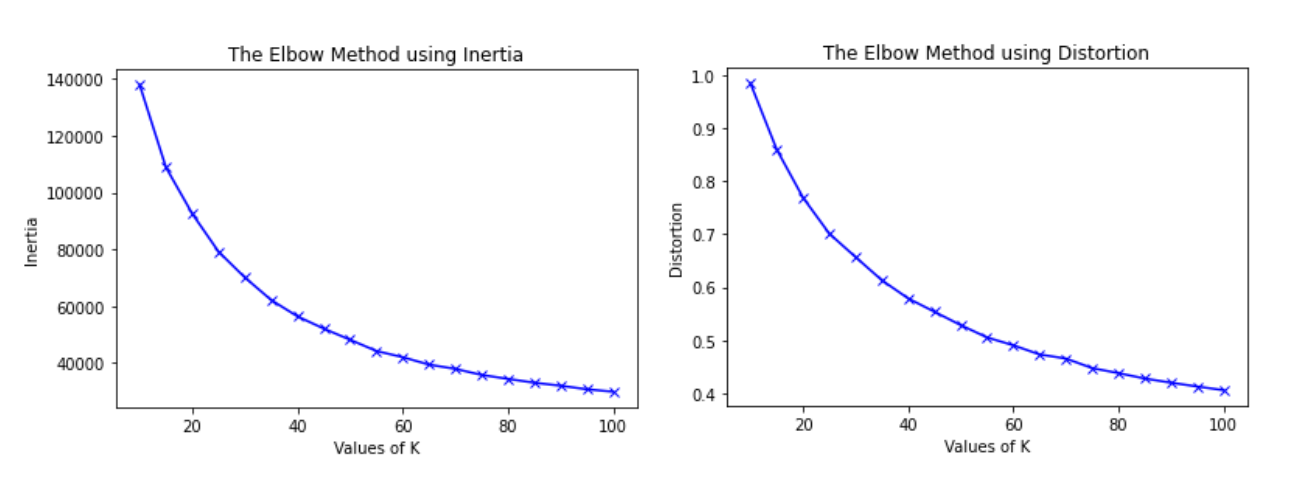
The curves of these plots appear to bend when there are between 40 and 50 clusters.
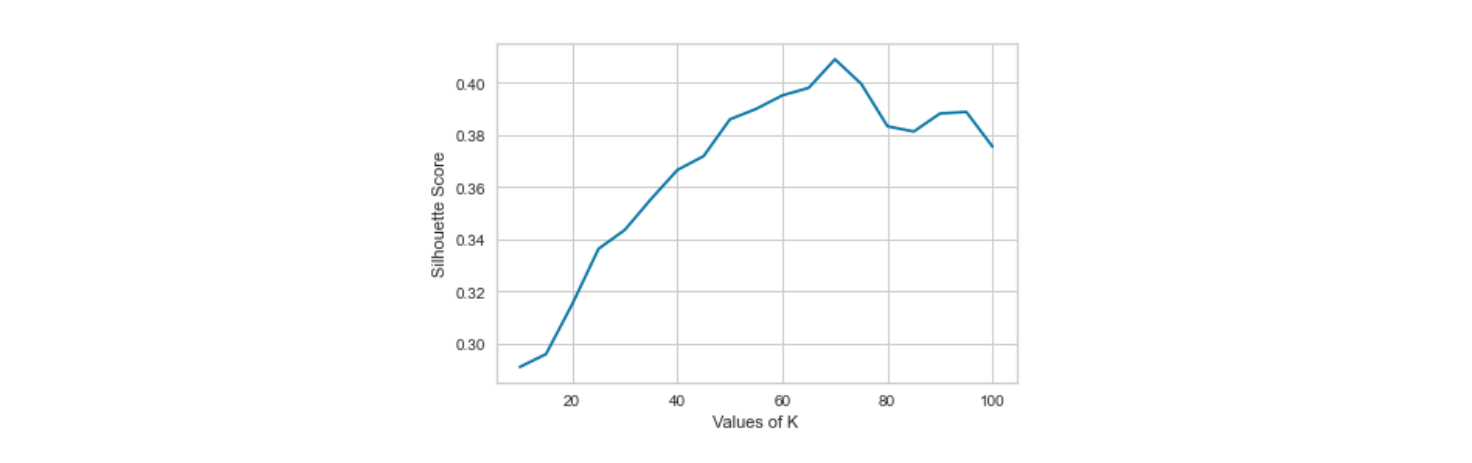
The highest average silhouette score is achieved when there are 70 clusters. These two methods suggest different values for the optimal number of clusters. Since the results of these methods do not provide a definitive value, we used the ground truth labels to validate the clustering by comparing the cluster labels for different values of k with the ground truth labels. Since our objective is to compare similarities and differences across gestures in different sign languages, an ideal clustering algorithm would cluster the data points so that a unique gesture is part of a single cluster (e.g. all of the images of the letter ‘A’ in ASL would be part of the same cluster, along with other similar gestures in the dataset). We would expect that each cluster would contain a mix of gestures from different sign languages and that the same gestures would belong to the same cluster. However, as we increased the number of clusters, the gestures were being separated into more clusters. For example, when there are 50 clusters, American Sign Language images belong to all 50 clusters, even though there are 28 gestures represented in the dataset. This suggests that as the number of clusters increases, the algorithm does not learn new clusters for unique gestures, rather the algorithm further separates a gesture into more clusters. Since we found that ASL gestures tended to be present in all of the clusters, we chose to perform K-means clustering with 30 clusters because there are 28 gestures in ASL. Since higher values of k result in less interpretable clusters, this value of k improved the interpretability of the results.
Clustering Result
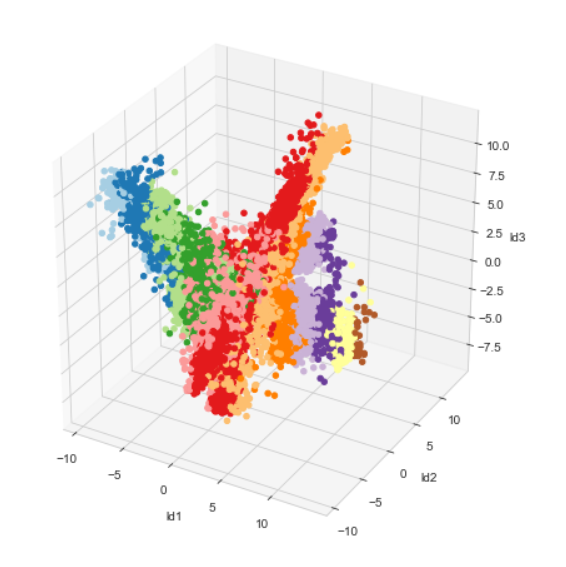
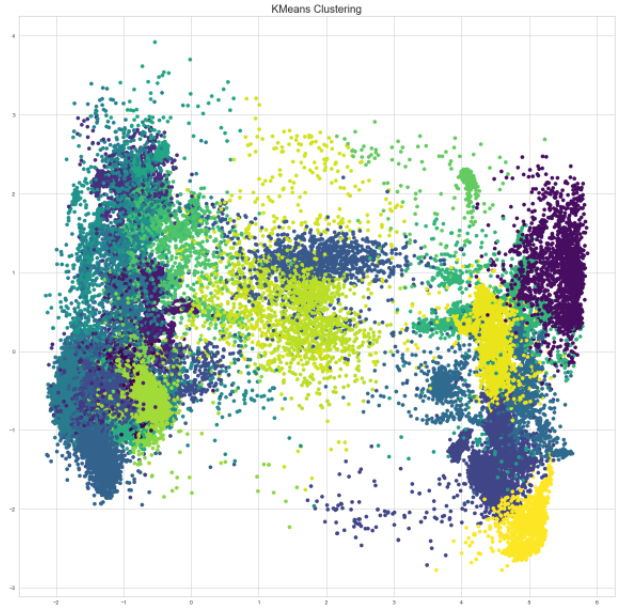
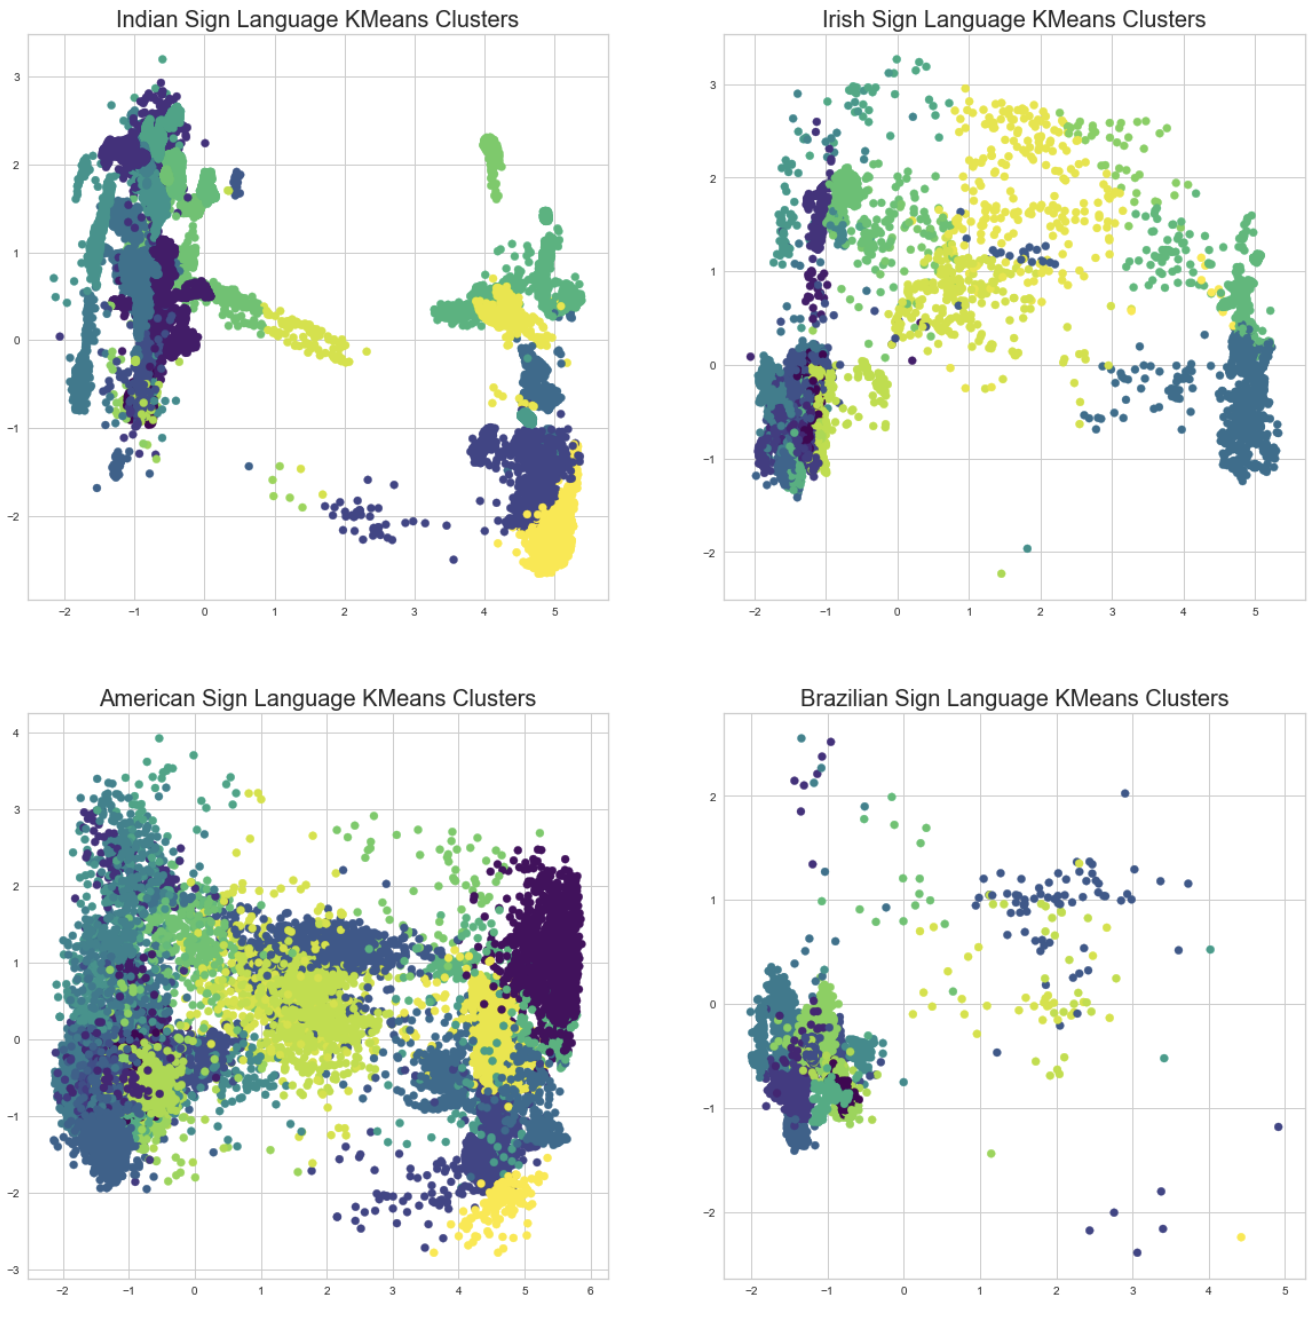
The results of K-means clustering with 30 clusters is visualized in the figure below where each color represents a different cluster. Each data point represents a single character belonging to a single language. Hence, each cluster is made up of different and same characters from different languages.
The figures below are the subsets of the data points from the 30 clusters filtered by each sign language. The cluster distribution of ASL and Irish Sign Language tend to have similar patterns which are less distinguishable in the first two principal components. On the contrary, there are two big cluster groups that are almost linearly separable in the Indian Sign Language. The boundaries between individual clusters are also more clear than in the ASL. This implies that the characters in the Indian Sign Language tend to be more distinct from each other than in the ASL and Irish Sign Language. Last but not least, the Brazilian Sign Language has a bulk mixture of different clusters and many scattered data points that appear to be noisy images.
Of the 30 clusters, Indian sign language gestures appear in 27 clusters; Irish sign language gestures appear in 26 clusters; Brazilian sign language gestures appear in 23 clusters; and English sign language gestures appear in 30 clusters. The table below compares the number of gestures from each language represented in the dataset with the number of clusters to which a language belongs.

Some of the languages belong to more clusters than there are unique gestures in its alphabet. When we inspected the number of observations by gesture of language in each cluster, we noticed that many clusters contained a few observations of a particular gesture. In fact, there are 170 instances in which a cluster contains a single datapoint for a particular gesture. This suggests that the input data is noisy. To improve the interpretation of the clustering, we filtered out observations when there were less than ten observations of a particular gesture in a cluster. As a result, we discarded 1,316 observations. Discarding these noisy observations slightly affected the number of clusters to which a language belongs.
Matching-based Clustering Performance
As a complement to the performance measure of elbow method and silhouette score, we also used external information metrics such as precision, recall and F-1 score. While doing these calculations, we set the ground truth as the character from a particular language that has the maximum representation in that cluster. Results of the first few clusters are summarized in the table below. The average F-1 score of all clusters is 0.54.
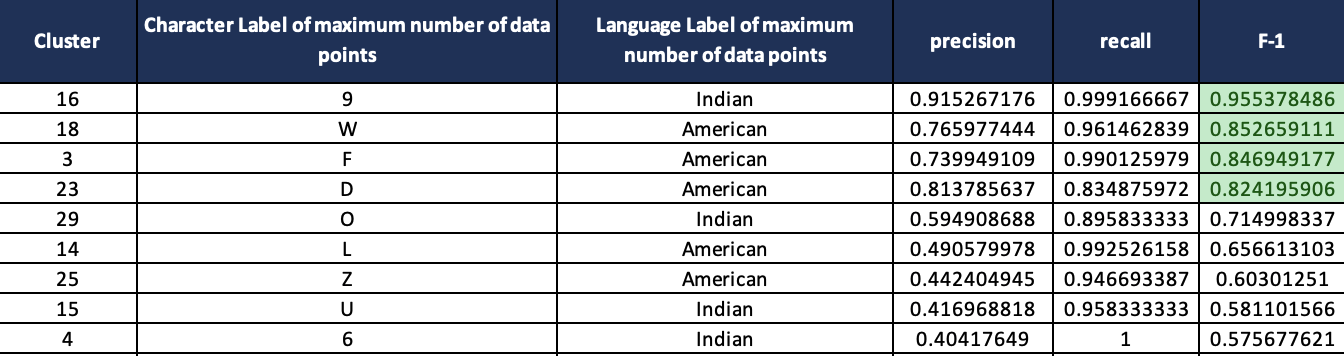
The table represents the purity of a cluster, for instance, the majority of data points in cluster 16 belong to the Indian character “9”. Hence, other characters belonging to ASL and other sign languages will be considered misclassified for cluster 16. Based on this intuition, classification metrics are calculated for cluster 16.
While we are using external metrics to measure clustering performance, it is important to consider that for an imbalanced data set, these metrics can be misleading. For instance, if there is a cluster with 40 ASL “A” characters and 10 ASL “H” characters then as per our method, ground truth for that cluster will be ASL “A” and ASL “H” will be considered misclassified. However, given that there are in total 10 ASL “H” characters in our data set and all of those characters end up in that cluster then, it will be not correct to consider them misclassified. To circumvent this limitation, we can consider internal matching metrics such as Silhouette Coefficients. The limitation with Silhouette Coefficient in that case would be that given a scenario where a given cluster is huge and its members are situated in corners, in that case cluster members will be far from other members within the cluster but closer to members of other clusters. In this scenario, the Silhouette Coefficient will be low and that could be misleading, too. It is important to keep in mind that both the performance measures using internal and external information have their own strengths and weaknesses.
6. Conclusion
In this project, we applied both supervised and unsupervised machine learning methods to sign language recognition. For supervised learning, we focused on classifying images of different characters in the American Sign Language (ASL). For unsupervised learning, we used clustering to identify the similarity between gestures of characters in different sign languages.
In the data preprocessing stage, we used OpenCV filters to adjust the image quality and applied the MediaPipe framework to extract the coordinates of key points on a hand as the features for each image. We also developed a normalization method to correct the rotation angles and scales of different images to improve the result in the unsupervised learning.
For the supervised classification, we performed dimensionality reduction methods for feature engineering. We trained multiple classification models, conducted hyperparameter tuning with cross-validation, and evaluated the model performance using multiple accuracy metrics. We selected KNN as our final model, which achieved a F1 score of 84% on the hold-out test dataset.
For the unsupervised clustering, we applied K-means on over 120 thousand images of 104 unique characters from 4 different sign languages. We evaluated the clustering performance based on both the internal and external information. We found that the gestures in the Indian Sign Language tend to be more distinct from each other than in the ASL and Irish Sign Language.
Using supervised and unsupervised machine learning, we were able to implement a highly accurate classification model for ASL images and identify insightful patterns among different sign languages. We also recognized that the unsupervised learning has still development potential in the sign language domain.
7. Presentation
Presentation Slides
References
[1] M. M. Zaki and S. I. Shaheen, “Sign language recognition using a combination of new vision based features”, Pattern Recognition Letters, vol. 32, pp. 572-577, 2011
[2] Kakoty, N. M., & Sharma, M. D. (2018). Recognition of sign language alphabets and numbers based on hand kinematics using a data glove. Procedia Computer Science, 133, 55–62.
[3] Sakshi Sharma, Sukhwinder Singh,Vision-based hand gesture recognition using deep learning for the interpretation of sign language,Expert Systems with Applications,Volume 182,2021
[4] Xiao, Q., Qin, M., & Yin, Y. (2020). Skeleton-based Chinese sign language recognition and generation for bidirectional communication between deaf and hearing people. Neural Networks, 125, 41–55.
[5] Lugaresi, C., Tang, J., Nash, H., McClanahan, C., Uboweja, E., Hays, M., … & Grundmann, M. (2019). Mediapipe: A framework for building perception pipelines. arXiv preprint arXiv:1906.08172.