Midterm Report
Jenna Gottschalk, Hechen Li, Ahmed Rabbani, Ahindrila Saha, Sai Yang
Background
According to the World Health Organization, 5% of the world population suffers from speech-hearing impairment. Sign language recognition is an indispensable foundation for machine translation to bridge the gaps in communication between the hearing and the hearing-speech impaired communities.
Problem Definition
Sign language translation takes an image containing a sign language gesture and outputs the corresponding meaning as text. It can be divided into two major steps: feature extraction and classification. Earlier approaches use PCA and Kurtosis position [1] for feature extraction and Hidden Markov Model [1] or SVM [2] for classification. With the advance of deep learning, recent models using CNN [3] generally outperform previous methods. However, CNN-based models learn from the RGB pixel data directly. While some methods use more advanced skeleton features [4], this requires users to wear tracking devices. Therefore, we want to explore a new approach that only requires image input: extract hand skeletons from images using the state-of-the-art MediaPipe framework [5], and then use supervised algorithms to perform the classification.
Data Collection and Preprocessing
In the data preprocessing stage, we utilized the ASL Alphabet dataset of 87,000 labeled images and the ASL Alphabet Test dataset of 870 labeled images with noisy backgrounds. We extracted the features from the image data using MediaPipe[5]. Given an input frame, MediaPipe detects the hand in the image and outputs the position of 21 key points on the hand. We used the (x, y, z) coordinates of these points as features, so there are 63 features in total. Although we can learn from the pixel data directly, we prefer this state-of-the-art pose detection framework, which extracts more structural and meaningful features than CNN or general image feature extractors.
However, MediaPipe failed to detect the hand in many input images. After inspection, we think the reason was these images were too dark; some images only show merely silhouettes of hands. Therefore, before feeding the image into MediaPipe, we first increased the exposure by adjusting the gamma, and then increased the contrast. These two steps were implemented using two OpenCV filters. We also set the maximum hand number to 1 and minimal detection confidence to 0.1 because the input images are guaranteed to have one and only one hand. More images were recognized by MediaPipe after the transformation, but there was still a portion that failed (perhaps because they were too dark and fingers were not separated). We discarded images that were not recognized by MediaPipe. Additionally, we discarded images with labels ‘J’ and ‘Z’ because these sign language gestures involve movement that cannot be easily captured with a single image and we discarded images with labels ‘delete’ and ‘space’ because we are only classifying letters. Overall, 59,822 images (69% of the dataset) were used.
Methods
Our machine learning methods cover two parts: feature engineering and model fitting.
Feature Engineering
We tried three different dimensionality reduction methods: Principal Component Analysis, Linear Discriminant Analysis, and LASSO. For Principal Component Analysis and Linear Discriminant Analysis, we selected the components that explained at least 95% of the variance of the original extracted features. For LASSO, we performed cross-validation to find the optimal value of alpha, the parameter that balances minimizing the residual sum of squares and minimizing the sum of squared coefficients. Using this value of alpha, we performed LASSO and selected the features with non-zero coefficients from LASSO to select a subset of the extracted features. We evaluated the performance of the results from Principal Component Analysis, Linear Discriminant Analysis and LASSO using K-Nearest Neighbors, Support Vector Machine, and Logistic Regression. We chose the dimensionality reduction method with the highest performance on these models, and we used the results of this method as input for the machine learning models.
Model Fitting
In the modeling stage, we first performed supervised machine learning. We divided our entire dataset into training and testing sets (80 percent training and 20 percent for testing). We used the selected features from LDA, the best-performing feature engineering method that we tested, to fit multiple classification models. They include conventional classification models, for example logistic regression and SVM, and non-linear models like gradient boosting and neural network. For model evaluation, we used the metrics F1 score, precision, and recall to assess and compare the general performance of each model. We also compared the model performance on each label based on the F1 score.
For the unsupervised clustering task, we will use the extracted features to compare gestures across different sign languages. We will cluster the sign language images using K-means and DBSCAN to explore similarities and differences of the gestures from different sign languages.
Results and Discussion
Dimensionality Reduction and Feature Selection
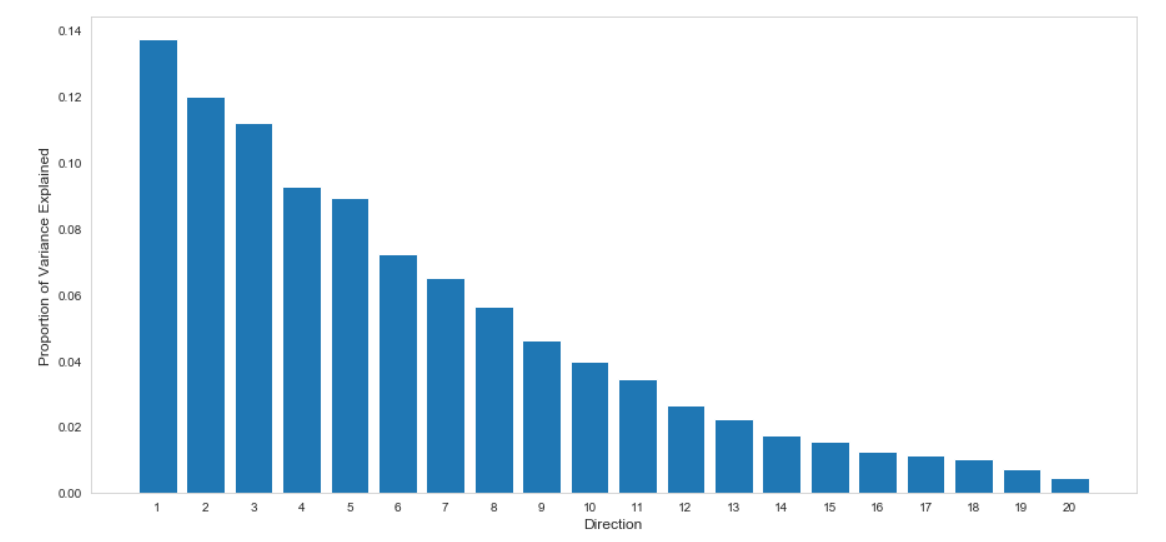
After performing Principal Component Analysis, we plotted the percentage of variance explained by each component. We observed that the first 10 components explained more than 95% of the variance in the original data set, which we selected to represent our training data. We repeated the same procedure while performing LDA and selected the first 10 LDA components to represent our training data (Figure 1).
We found that the optimal alpha value for LASSO is 2.0. However, LASSO regression with an alpha value of 2.0 reduced all of the coefficients to zero. Although not optimal, we performed LASSO regression with an alpha value of 0.5, which resulted in 6 selected coefficients that were chosen to represent our training data.
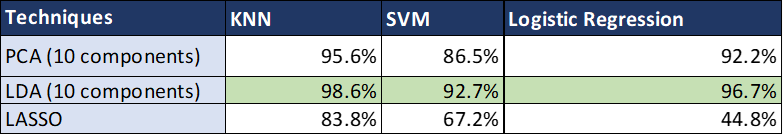
We evaluated the dimensionality reduction methods by comparing their accuracies across three classification models (Table 1). The LDA’s accuracy metric was the highest among the applied dimensionality reduction techniques.
Linear Discriminant Analysis is a supervised learning method that takes the labels into account while performing dimensionality reduction. LDA chooses new dimensions such that the separability between different classes is maximized. Principal Component Analysis, on the other hand, is an unsupervised method that focuses on capturing the direction of maximum variation of the dataset. This may explain LDA’s higher performance across the three classification models. Additionally, we visually explored the clustering performed by the first 3 components of PCA and LDA respectively, and we observed that LDA resulted in more separated clustering as compared to PCA, which can be seen in Figure 2. So, we used LDA for performing dimensionality reduction and then used the compressed feature set for training.

Overall Model Performance
Using the first ten LDA components, we trained multiple supervised classification models and evaluated the overall performance of each model on our test dataset.
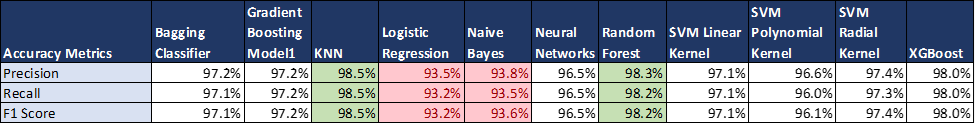
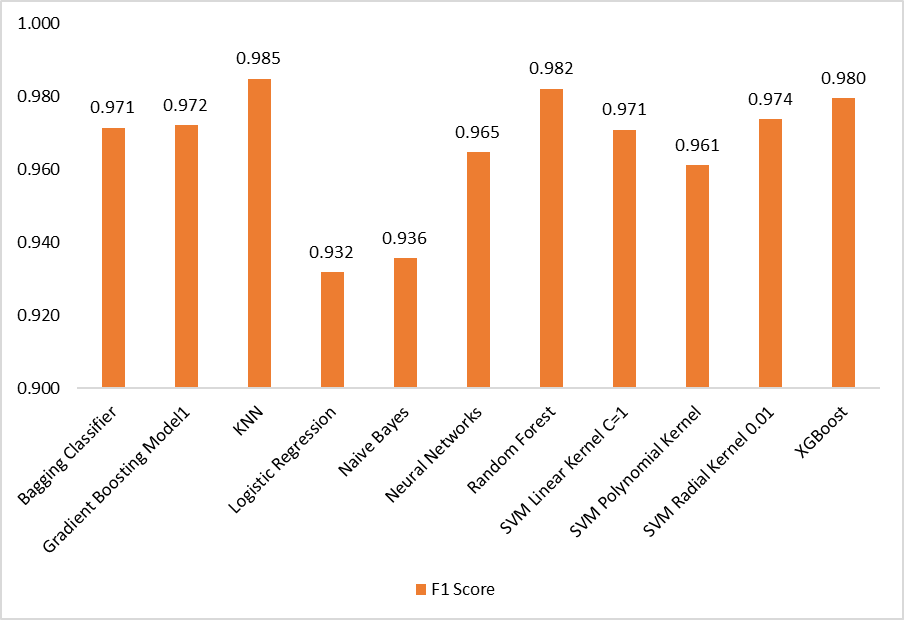
Table 2 shows the overall performance of all the supervised classification models that we trained. We computed the Precision, Recall, and F1 scores of each model on the test set. As per Table 2 and Figure 3, Random Forest and KNN outperformed other models on all performance metrics, which are greater than 98%. On the other hand, Logistic Regression and Naive Bayes performed poorly among all the models, with Precision, Recall and F1 Scores of less than 95%. The underlying reasons for the difference in observed performances were further explored through label-wise model evaluation, which is explained in subsequent sections.
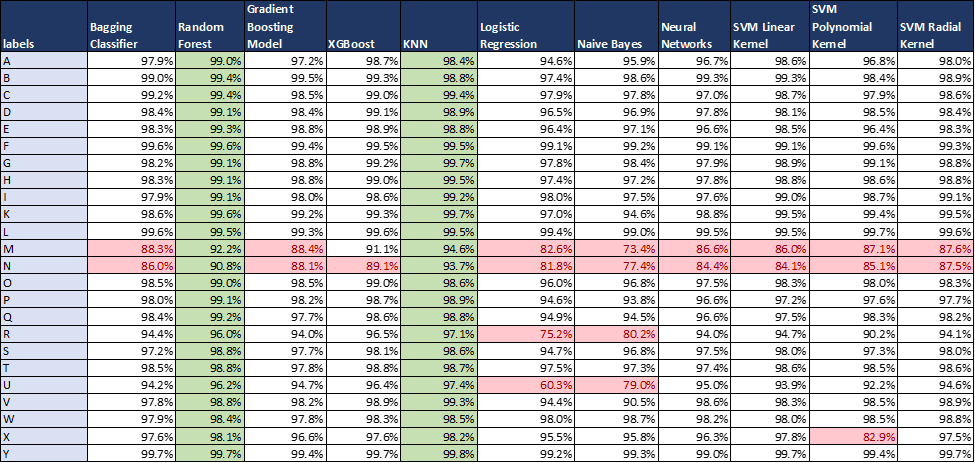
Label-wise Model Performance
In Table 3, we compared the classification performance by using the F-1 scores across all labels and models on the test set. We prefer to use F-1 scores as it is the harmonic mean of both recall and precision and considers both of these metrics. The Random Forest and KNN outperform other models in terms of classifying all the labels accurately (F-1 scores are more than 90 percent for all labels). Logistic Regression and Naive Bayes perform poorly in classifying ‘U’ and ‘R’ where the F-1 scores are less than 80 percent especially for ‘U’ in logistic regression where the F-1 score value falls to 60 percent. For other models, except for letters ‘M’ and ‘N,’ all other labels have F-1 scores above 90 percent. The ‘M’ and ‘N’ scores have scores in the ranges of 85-90 percent, which can be further improved by feature engineering. One of the reasons for the lower F-1 scores of the labels is that the hand gestures for these letters are very similar. For example, if we compare the gesture/sign language of ‘M’ and ‘N’ their signs are almost identical (both are shown using joined hand fists). So, other models are not able to classify properly too similar-looking labels.
Next Steps
As a future step, we plan to use Random Forest, KNN and XG- Boost models and perform hyperparameter tuning on these models using K-fold cross-validation. We will then use the test set to compare the performance of the three selected models and choose our final model. Lastly, we will perform validation of the final model on unseen image data with extremely noisy backgrounds to check the applicability of our models in real-world environments.
If time permits, we will also perform an unsupervised clustering task using K-means and DBSCAN to explore the similarities and differences of the gestures from different sign languages.
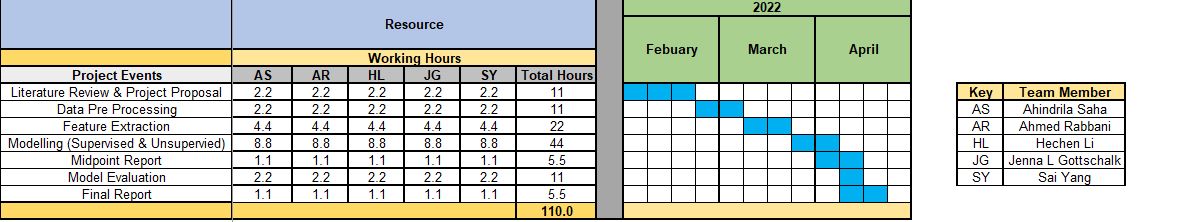
We will continue our project as planned in Table 4.
References
[1] M. M. Zaki and S. I. Shaheen, “Sign language recognition using a combination of new vision based features”, Pattern Recognition Letters, vol. 32, pp. 572-577, 2011
[2] Kakoty, N. M., & Sharma, M. D. (2018). Recognition of sign language alphabets and numbers based on hand kinematics using a data glove. Procedia Computer Science, 133, 55–62.
[3] Sakshi Sharma, Sukhwinder Singh,Vision-based hand gesture recognition using deep learning for the interpretation of sign language,Expert Systems with Applications,Volume 182,2021
[4] Xiao, Q., Qin, M., & Yin, Y. (2020). Skeleton-based Chinese sign language recognition and generation for bidirectional communication between deaf and hearing people. Neural Networks, 125, 41–55.
[5] Lugaresi, C., Tang, J., Nash, H., McClanahan, C., Uboweja, E., Hays, M., … & Grundmann, M. (2019). Mediapipe: A framework for building perception pipelines. arXiv preprint arXiv:1906.08172.